 网络

现场常见问题
Most IT teams find out the network is down when someone phones. With no history they can't say whether the ISP dropped, a switch overheated or a link filled up. When they call the ISP there's no evidence, and the answer is usually "everything is fine on our side".
An NMS collects data from every device over SNMP, ICMP, NetFlow/sFlow, syslog and APIs: routers, switches, firewalls, APs, servers, UPS units and CCTV cameras. When something crosses a threshold it alerts by email, Telegram, LINE or WhatsApp.
What we monitor at a minimum
- Up/down and latency for every device and every internet circuit
- Bandwidth per port and who is using the most (top talkers)
- CPU, memory, temperature, fans and UPS batteries
- Config changes and key security logs
The third item gets forgotten, but in Laos it matters. A "UPS on battery" alert at 18:00 tells you how many minutes you have before the server room goes dark.
Open source or vendor tools
Most of the time we use Zabbix: open source, scalable, and it watches every brand. If everything is one vendor, that vendor's dashboard (a cloud controller, say) may be enough. Monthly uptime reports give management real numbers when deciding whether to change ISP or replace switches.
功能
Live dashboards
Network maps and live status of every device.
Instant alerts
Email, Telegram, LINE or WhatsApp, routed by severity.
Traffic analysis
NetFlow/sFlow shows who and what is eating bandwidth.
Evidence for your ISP
Latency and loss history as graphs you can send straight to the provider.
UPS and temperature
Know immediately when power fails or the server-room aircon stops.
Monthly reports
Uptime, utilisation and trends for management.
设计与实施
- 1
List devices and agree what to monitor
- 2
Deploy the NMS (VM or appliance) and branch proxies
- 3
Enable SNMPv3, syslog and NetFlow securely
- 4
Build dashboards, thresholds and alert routing
- 5
Tune until alerts mean something, then train the team
适用场景
- Multi-branch organizations watching every province on one screen
- Banks needing uptime reports for internal audit
- Mines and plants that need to know the moment a switch or radio link drops
- Hotels catching Wi-Fi and ISP problems before guests complain
常见系统规模
Essential
适用于: Up to 50 devices, one site
- Up/down and bandwidth monitoring
- Email/Telegram alerts
- Baseline dashboards
Multi-site
适用于: 50–500 devices, several sites
- NetFlow and ISP monitoring
- Branch proxies and network maps
- Monthly uptime reports
Managed NOC
适用于: You want us to watch and act on alerts
- Our team receives alerts and acts on them
- We chase the ISP for you
- Quarterly reviews
我们供货并安装的品牌
所有品牌名称和商标归其各自所有者所有。除非另有明确说明,提及某品牌并不代表与其存在合作关系。产品均通过正规分销渠道采购。
常见问题
Is Zabbix really free?
The software is free, with no licence fee. What it costs is time to deploy, tune and look after. We can do that, or teach your team to.
Won't we be flooded with alerts?
For the first couple of weeks, maybe. We tune thresholds and set dependencies: if a branch router is down you get one alert, not one per switch behind it. After that, every alert means something.
Does it need its own server?
Usually a VM on existing infrastructure or a small dedicated box. It must sit behind a UPS. An alerting system that dies with the power is no use to anyone.
相关指南
网络监控入门:在用户来电之前发现问题
该监控什么,SNMP、syslog 和 NetFlow 各自用途,如何告警而不让团队疲于奔命,以及老挝中型机构如何起步。
双 ISP 互联网冗余:光纤被挖断时怎么办
主备切换还是负载均衡,如何挑选不会同时故障的两家运营商,所需设备,以及如何测试切换确保真正可用。
网管与非网管交换机:外观相似,差别很大
非网管、智能和全网管交换机有何不同,何时非网管仍够用,二层与三层,以及每台网管交换机都应做的八项设置。
在老挝如何选择 IT 服务商:每家供应商都该被问的问题(包括我们)
一份中立的 IT 服务商评估清单:谁真正干活、设备从哪里来、保修在老挝是否有效、SLA、文档交付以及危险信号。
酒店 Wi-Fi 设计指南:从客房到宴会厅和花园别墅
客房内 AP 布点、对接 PMS 的认证门户、让客人远离酒店内部系统、带宽计算示例,以及老挝酒店的特殊情况。
办公网络设计:采购之前要先定下什么
为老挝 20–300 人办公室设计局域网、Wi-Fi、防火墙和供电时,工程师的决策顺序,附检查清单和分阶段预算。
相关计算工具

相关解决方案
网络
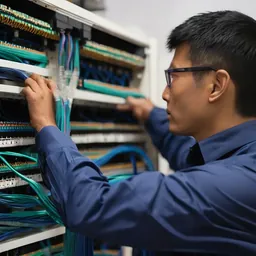 综合布线Cat6/Cat6A 与光纤,两端贴标签,每条链路逐一测试,并移交竣工图纸。布线一次做对,可用 15 年以上。
 企业局域网与交换核心–接入架构的局域网,划分 VLAN,上联冗余,PoE 供电充足。一根插错形成环路的网线,再也不会让整栋楼断网。
 企业 Wi-FiWi-Fi 6/6E/7,AP 点位依据实测部署。会议室满员也能用,走动通话不断线,采用 WPA3 加密。
 分支机构 SD-WAN外省分支同时使用两条互联网线路,一条故障另一条数秒内接管,全程加密。
 光纤骨干与园区互联楼层、楼宇和站点之间 10–100 Gbps 光纤互联。光纤不导电,雷击不会沿线路从一栋楼传到另一栋。
 点对点无线链路数公里 PtP/PtMP 无线链路,跨越道路和河流,连接无法布线的楼宇和站点。
发给我们建筑平面图或几张现场照片
我们会先询问一些细节,再给出初步设计方案。首次咨询免费,可用老挝语、泰语或英语,通过 WhatsApp 或 Facebook 主页联系。